
Usually we tend to think of the WWW as a tool for research, and I’ll dive into some of the ways that I make use of specific tools to search and mine the web for resources into a later post, but today I wanted to share a bit about how the web can serve as a subject for research. Web social science is the next big thing, with regular sessions now appearing at many major academic society conferences.  If you want to get the big overview, I’d recommend you start with Robert Ackland’s recent book, Web Social Science: Concepts, Data and Tools for Social Scientists in the Digital Age (University users can click here to read the book online via the University of Edinburgh library). Ackland’s book is a terrific resource, covering both qualitative and quantitative modes of research and he covers a large range of tools from online surveys and focus groups, web content gathering and analysis, social media network analysis (which I’ll discuss in a future post), and online experimentation. For an author who is quite technical the book covers a very helpful range of ethical considerations, surveys a range of contemporary methodological literature, and he presents the domain of research involved in each of these which would be accessible to a readership that hasn’t done this kind of work before. A few years ago when I began doing web social science and social network analysis, I found Acklands book to be a terrific catalyst into the wider field of web studies. Continue reading
Category: big data
The Command Line
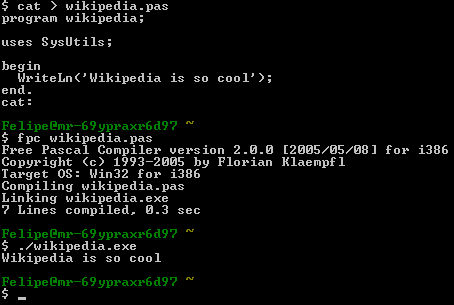
I’ll often be working on my laptop when a colleague walks past, sees a command-line window open with lines scrolling and says something like, “well that looks scary!”. The producers of the matrix captured this sentiment well with their now classic screen image that shows indecipherable characters cascading down a screen.
I think that one of the least appreciated tools might be the command line. Most folks assume that it is the exclusive domain of software engineers (or Matrix insurgents) and miss out on the efficient data manipulation that is just one step away on the command line (or if you write your own code, but we’ll save that for another post!). Continue reading
Google Ngram Viewer
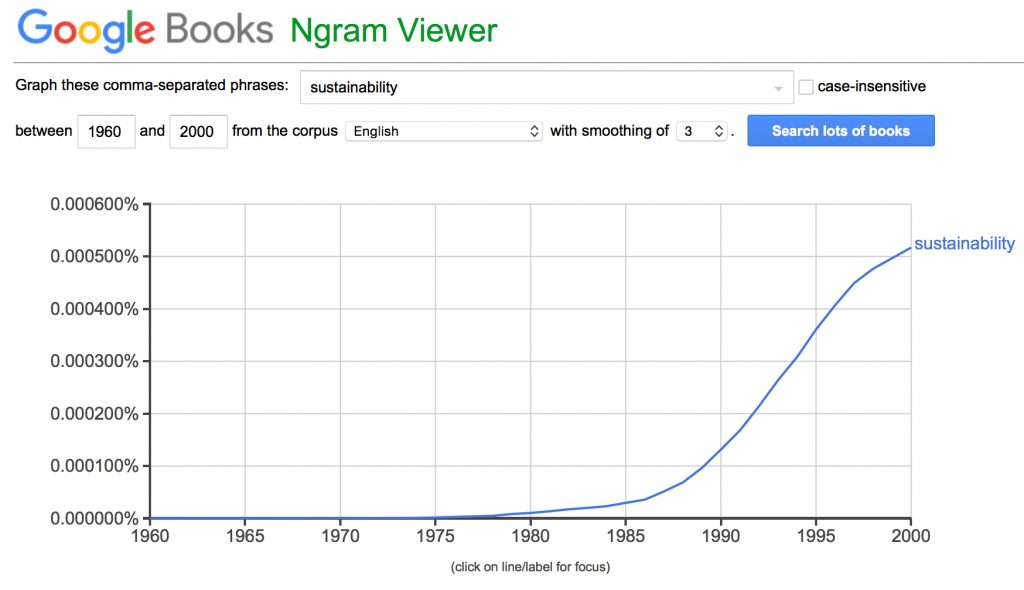
Have you ever had the sense that some term or word which we take for granted might have come into popular use very recently? Or perhaps you wonder if popular usage of some descriptor might have waxed and waned over time? If you’d looking for a quick way to visualise this as data, check out Google’s NGram viewer. If you haven’t already spent time using google books, then I’d recommend you start there. They’ve become a digitizing juggernaut, sometimes in cooperation with University libraries in an effort to create what they describe as “the world’s most comprehensive index of full-text books.” And honestly, they’re probably right.
Having millions of digitized books available is an absolute dream for big data folks such as myself, and Google has been accommodating to people wanting to run research on the database. This can be quite sophisticated, but you can also use NGram viewer for more basic searches. Head on over to the site to check it out for yourself: https://books.google.com/ngrams. There are a few basic functions – you can narrow the search field (which defaults to 1800-2000) and specify the language. You can also run comparative searches on several words, just separate them with commas. Give it a whirl – and let me know in the comments what strange discoveries you make!
I tried a quick search on the much contested term “sustainability” and confirmed that it is indeed a word that no one really bothered using before 1980. There you go.
If you want to go really wild, Google makes all their data available through an API. I have in mind to spend some more time working with this tool on my next project which will look at the early (pre-1920) history of environmentalism in Britain and America. Stay tuned for more charts!